


How Do Different Generations Spend Their Money on Food?
Americans’ food spending habits have a changed a lot in the past century. Individuals from the Silent Generation, the demographic directly after the Great Depression, spend their money much differently than the members of Generation Z. How much does the average person spend on food? Which generations are spending the most on fruits, vegetables, and meat? Are younger generations dining out more often than older generations?
How To Cook Recipes took a look at food spending information from the Bureau of Labor Statistics Consumer Expenditures Survey to see just how different generations spend their money on what they eat and compare the average money spent on food per month.
A Look at Generational Food Spending
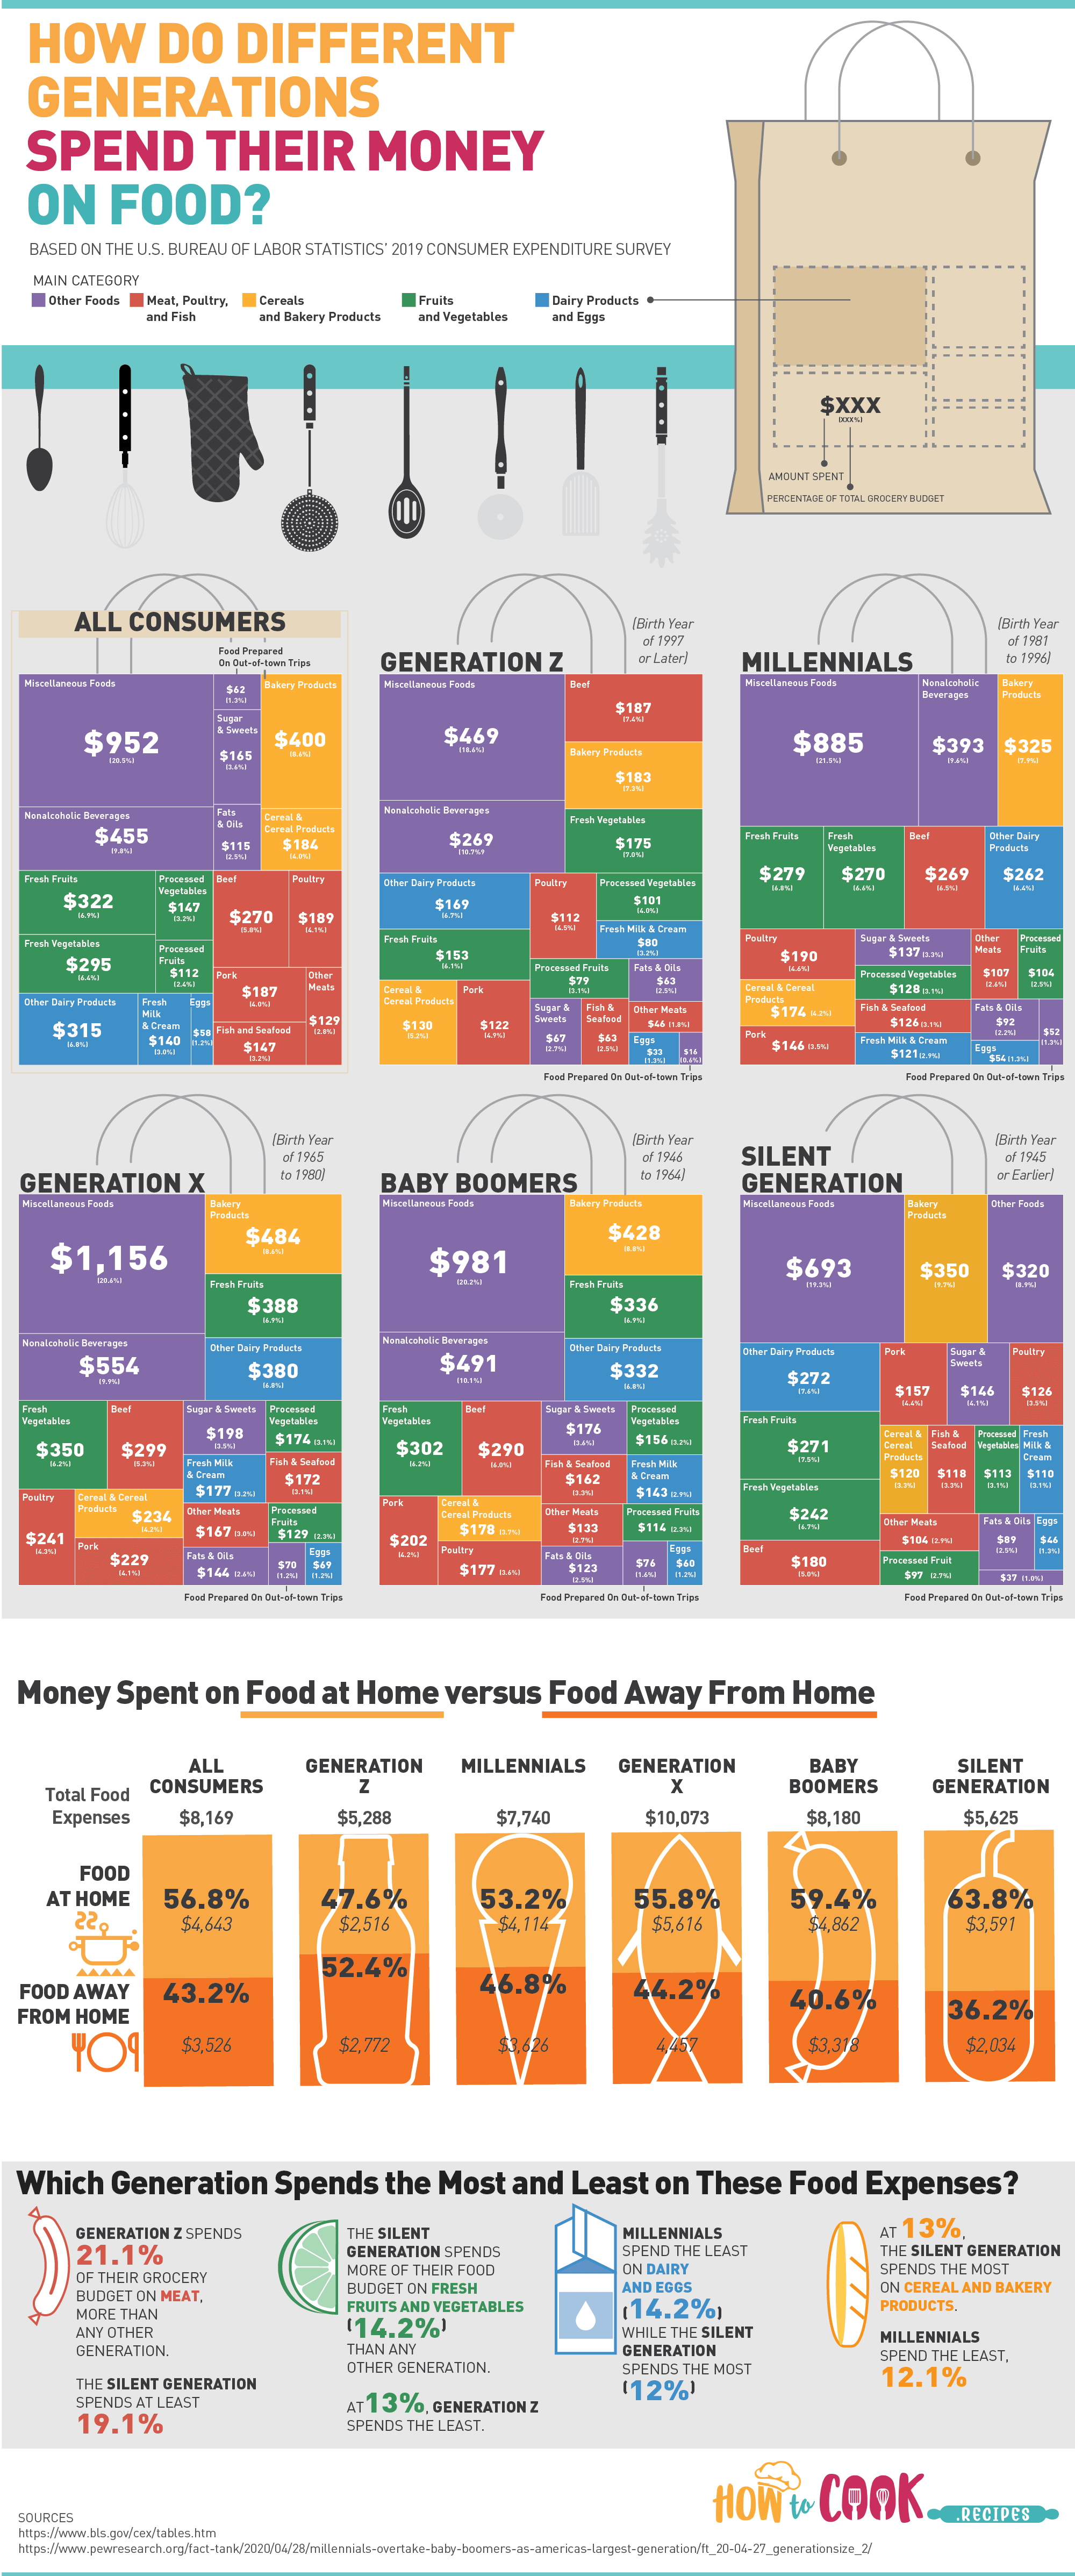
Our graphic compares food spending in five main generational cohorts: the Silent Generation (born in 1945 or earlier), Baby Boomers (born between 1946 and 1964), Generation X (born between 1965 and 1980), Millennials (born between 1981 and 1996), and Generation Z (born in 1997 or later).
When it comes to eating food at home versus eating food away from home (for example, at restaurants and bars), there were some significant differences. Generation Z is much more likely to spend their food money on meals away from home: 52.4% of their total food expenses go toward food eaten outside of the home, which amounts to an average of $2,772 per year. On the other end of the spectrum, those in the Silent Generation are much more likely to spend their money on food they eat and cook at home. On average, 63.8% of their food budget is dedicated to food consumed at home. How much does the average person spend on groceries? The average American spends $4,643 on food eaten at home every year.
We also took a closer look at exactly what Americans are spending their money on when they do buy food at the grocery store. The following is the breakdown of the percentage of their grocery budget each generation spends on specific food items:
| Grocery Expense | Generation Z | Millennials | Generation X | Baby Boomers | Silent Generation |
| Bakery Products | 7.3% | 7.9% | 8.6% | 8.8% | 9.7% |
| Beef | 7.4% | 6.5% | 5.3% | 6.0% | 5.0% |
| Cereal and Cereal Products | 5.2% | 4.2% | 4.2% | 3.7% | 3.3% |
| Eggs | 1.3% | 1.3% | 1.2% | 1.2% | 1.3% |
| Fats and Oils | 2.5% | 2.2% | 2.6% | 2.5% | 2.5% |
| Fish and Seafood | 2.5% | 3.1% | 3.1% | 3.3% | 3.3% |
| Food Prepared on Out-of-Town Trips | 0.6% | 1.3% | 1.2% | 1.6% | 1.0% |
| Fresh Fruits | 6.1% | 6.8% | 6.9% | 6.9% | 7.5% |
| Fresh Milk and Cream | 3.2% | 2.9% | 3.2% | 2.9% | 3.1% |
| Fresh Vegetables | 7.0% | 6.6% | 6.2% | 6.2% | 6.7% |
| Miscellaneous Foods | 18.6% | 21.5% | 20.6% | 20.2% | 19.3% |
| Nonalcoholic Beverages | 10.7% | 9.6% | 9.9% | 10.1% | 8.9% |
| Other Dairy Products | 6.7% | 6.4% | 6.8% | 6.8% | 7.6% |
| Other Meats | 1.8% | 2.6% | 3.0% | 2.7% | 2.9% |
| Pork | 4.9% | 3.5% | 4.1% | 4.2% | 4.4% |
| Poultry | 4.5% | 4.6% | 4.3% | 3.6% | 3.5% |
| Processed Fruits | 3.1% | 2.5% | 2.3% | 2.3% | 2.7% |
| Processed Vegetables | 4.0% | 3.1% | 3.1% | 3.2% | 3.1% |
| Sugar and Sweets | 2.7% | 3.3% | 3.5% | 3.6% | 4.1% |
The average American food cost per month and year also varies by generation.
- Generation Z is the generation that spends the largest percentage of their food budget on meat (21%), while the Silent Generation spends the least (19.1%).
- When it comes to fresh fruits and vegetables, the Silent Generation spends more of their food budget (14.2%) in this category than other generations.
- The Silent Generation also spends more of their budget on dairy products (10.7%) and cereal and bakery products (13.0%) than other cohorts.
Trying to eat better? There are plenty of ways to incorporate more fruits and vegetables into your diet! Everything from stir fry to macaroni and cheese can be adapted to include more produce and less meat. While fresh fruits and vegetables aren’t always the cheapest foods to buy depending on where you live, frozen and canned produce can be great alternatives. Achieving a more healthful diet is easier than you think!
Use the following embed code to post this infographic on your website:
Classic Recipes
Perfect Recipes
Homemade Recipes
This page was last updated by Megan Miller